
Preview & performance metrics
Read Pixscape Studio Preview rendering, frame-time, Tiled, cache and Box2D metrics while a LibGDX scene is running.
On this page
Pixscape Studio Preview can display live rendering, frame-time, Tiled and physics metrics while a scene is running. The numbers describe the scene currently running inside Preview, not the main Studio canvas.
Press F9 while the Preview window has keyboard focus to show or hide the overlay. The timing sample resets each time you toggle it.
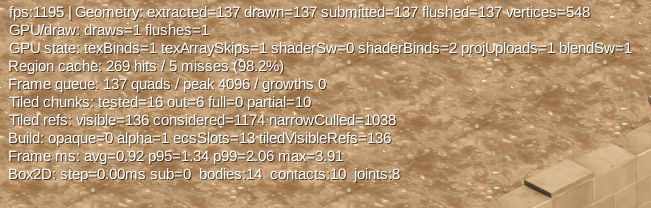
On Desktop, showing the overlay also disables vertical synchronization for Preview and Studio so the measurements are not capped by VSync. Press F9 again to hide the overlay and restore normal VSync. In HTML Preview, F9 toggles the overlay and resets its timing sample without changing VSync.
The values in the screenshot come from one scene at one moment. They illustrate the available signals; they are not targets or a Pixscape benchmark.
Rendering
Most rendering counters describe the current frame.
| Metric | Meaning |
|---|---|
fps | Preview frames per second reported by LibGDX. Use it as a quick summary, not as the only performance signal. |
extracted | Quads selected for the frame’s draw list after scene visibility and renderability checks. This can include regular scene content, visible Tiled references and effects. |
drawn | Quads passed through render submission. Repeated sprites can produce more drawn quads than their original queue entries. |
submitted | Quads accepted into a render batch. |
flushed | Batched quads sent when a batch was flushed. |
vertices | Vertex data sent by those flushes. A normal quad contributes four vertices. |
draws | GPU draw calls issued by the Pixscape render batches. |
flushes | Times buffered geometry was submitted. State changes and full buffers are common reasons for a flush. |
Compare the stages instead of treating each number in isolation. A difference can be legitimate—for example, repeated rendering can expand one queued entry into several drawn quads.
GPU state
The GPU state line shows how much graphics state changed while submitting the frame.
| Metric | Meaning |
|---|---|
texBinds | Texture or texture-array binds performed. |
texArraySkips | Texture-array binds avoided because the required array was already bound. |
shaderSw | Changes from one shader program to another. |
shaderBinds | Actual shader bind operations. A shader can be rebound without being a different shader, so this may exceed shaderSw. |
projUploads | Projection-matrix uploads to shaders. |
blendSw | Changes between blend states or render groups. |
Non-zero values are normal. These counters are most useful when a scene shows unexpectedly high state churn, or when a small content change causes a large increase in draws or flushes.
Region cache
The texture-array render path caches resolved texture regions so repeated sprites and tiles do not need to resolve the same region information repeatedly.
hitsare lookups served from the cache.missesrequire a region resolution before the result can be reused.- The percentage is
hits / (hits + misses)and gives a quick view of cache reuse.
These are cache counters rather than a required ratio. Occasional misses are expected, especially as different content is encountered. A higher hit rate generally means more repeated lookups are being reused, but there is no universal threshold that every scene should reach.
Frame queue
The frame queue contains the draw-ready geometry prepared for submission.
| Metric | Meaning |
|---|---|
quads | Entries in the current frame queue. |
peak | Highest queue capacity reached. This is allocated capacity, not a peak-usage count. |
growths | Automatic backing-storage expansions since the queue was initialized. |
A one-time growth while a scene starts or first reaches a complex view is not by itself a performance problem. Repeated growth during an otherwise steady workload can show that the scene has exceeded the queue’s previous capacity or that its visible complexity has increased.
Tiled rendering
Pixscape first classifies visible-area candidates by chunk, then performs narrower reference checks where a chunk only partly overlaps the view.
Tiled chunks
| Metric | Meaning |
|---|---|
tested | Candidate chunks tested against the current view. |
out | Tested chunks completely outside the view. |
full | Chunks completely inside the view; their renderable references do not need individual view-bound checks. |
partial | Chunks partially overlapping the view; their references receive narrower checks. |
Tiled refs
| Metric | Meaning |
|---|---|
considered | Renderable references in fully visible and partially visible chunks. |
visible | References left after chunk and narrow culling. |
narrowCulled | References rejected by the individual bounds checks inside partially visible chunks. |
Together these values show the progression from candidate Tiled content to content that contributes to the frame. They help reveal whether many chunks are tested, most candidates are outside the view, narrow culling removes substantial work, or the visible map itself is unusually dense. See Tiled Maps for the public Runtime API rather than renderer diagnostics.
Draw-list build
The Build line summarizes the work used to assemble the frame’s render list.
| Metric | Meaning |
|---|---|
opaque | Opaque render groups entered during submission. |
alpha | Blended render groups entered during submission. |
ecsSlots | Active ECS render slots scanned while building the draw list. |
tiledVisibleRefs | Visible Tiled references scanned while building the draw list. |
These are workload indicators, not counts of Java objects or authored layers. They are useful for comparing similar views of the same scene and seeing which kind of content contributes to a change.
Frame time
The Frame ms line measures start-to-start frame pacing over a sliding window of the most recent up to 600 frames. Values refresh four times per second. Pauses of one second or longer, such as debugging or switching away from the application, are excluded from the sample.
| Metric | Meaning |
|---|---|
avg | Average frame duration in the current sample. |
p95 | 95% of sampled frames completed at or below this duration. |
p99 | 99% of sampled frames completed at or below this duration. |
max | Longest frame duration in the current sample. |
Percentiles matter because a healthy average can hide occasional slow frames that still produce visible stutter. Check p95, p99 and max alongside FPS. The overlay is a fast way to relate frame pacing to scene activity; it does not replace a full CPU or GPU profiler when deeper investigation is required.
Box2D
The Box2D line reports the most recent physics update and the current physics-world counts.
| Metric | Meaning |
|---|---|
step | Time spent in the most recent Box2D step call, in milliseconds. |
sub | Fixed physics substeps performed by that call. This can be zero when not enough time has accumulated for another fixed step. |
bodies | Current total number of bodies in the Box2D world. It is not limited to awake bodies. |
contacts | Current contact count reported by Box2D. |
joints | Current joint count reported by Box2D. |
Contact count alone does not measure physics CPU cost. If overall frame time and Box2D step time rise together as body, contact or joint complexity increases, physics is a likely contributor. See Physics for the Studio authoring workflow.
What should I look for?
Too many draw calls or flushes
Compare draws and flushes with the GPU-state counters. Increases can come from shader changes, blend changes, texture changes, buffer limits or fragmented render groups. Look for changes relative to a known view of the same scene rather than an arbitrary target.
Frame-time spikes with a stable average
Check p95, p99 and max instead of relying on FPS or avg alone. Then compare the slow period with rendering, Tiled and Box2D activity.
High Tiled candidate counts
Compare chunk tested with out, full and partial, then compare reference considered with visible and narrowCulled. This separates a large candidate area from genuinely high visible map complexity.
Physics slowdown
Compare overall frame time with Box2D step time while watching bodies, contacts and joints. A relationship between those signals is more useful than any count by itself.
Cache misses
Occasional misses are normal. Persistent low reuse can indicate a workload that repeatedly encounters different regions and benefits less from the region cache.
FPS is therefore only one part of the picture. For performance work, read it together with frame-time percentiles, draw/flush/state metrics, Tiled culling, and Box2D metrics when physics is enabled.
Preview diagnostics only
This F9 overlay belongs to Studio Preview. It measures the scene running in Preview and is not automatically included as an overlay in an exported game.
Continue with: