
Debug console
Use the Pixscape Studio Debug console to inspect logs and diagnose editor workflows.
On this page
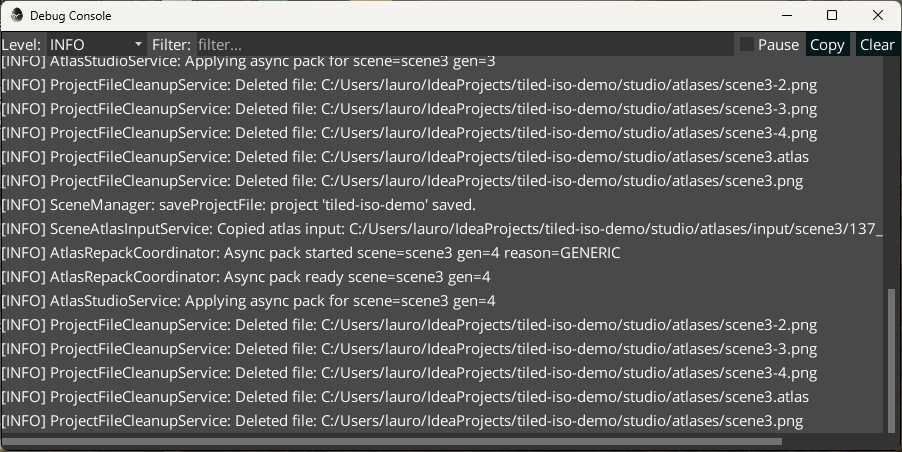
The Debug console shows messages produced by Pixscape Studio while the editor is running.
Open it from View > Debug Console.
It is useful for understanding what the editor is doing, checking import/export operations, diagnosing asset issues, and copying logs when reporting a problem.
Log level
Use the Level selector to choose which messages are displayed.
For normal usage, INFO is usually enough.
More detailed levels may be useful when investigating a problem.
Filtering logs
Use the Filter field to search inside the visible log output.
This is useful when the console contains many lines and you only want to see messages related to a specific service, file, asset, or scene.
Pause, copy, and clear
The console provides quick actions:
Pause: temporarily stops the log view from updating.Copy: copies the visible log content.Clear: clears the current console output.
Use Copy when you need to share logs while reporting a bug or asking for help.
Typical uses
The Debug console is useful when checking:
- whether a project was saved
- whether an atlas was rebuilt
- whether files were deleted or regenerated
- whether an import/export operation completed
- whether a warning or error occurred
Checklist
- Open the Debug console when something unexpected happens.
- Use the log level selector to control verbosity.
- Use the filter field to find relevant messages.
- Use
Copyto share useful logs. - Use
Clearbefore reproducing a problem to get a cleaner log.